
Realtime Analytics
The New Standard for Decentralized Clinical Trial Reporting Insights
THREAD analytics dashboards is the first solution designed to provide decentralized clinical trial operators with descriptive key performance indicators, predictive measures, and actionable insights to drive informed decision-making and optimized study performance utilizing:
- Descriptive analytics on study engagement and data management across stakeholders
- Predictive analytics that include study completion, enrollment, and retention
- Predictive analytics that include study completion, enrollment, and retention
THREAD analytics dashboards provide real-time participant data, predictive analytics, and intuitive performance metrics — accessible to all your study stakeholders.
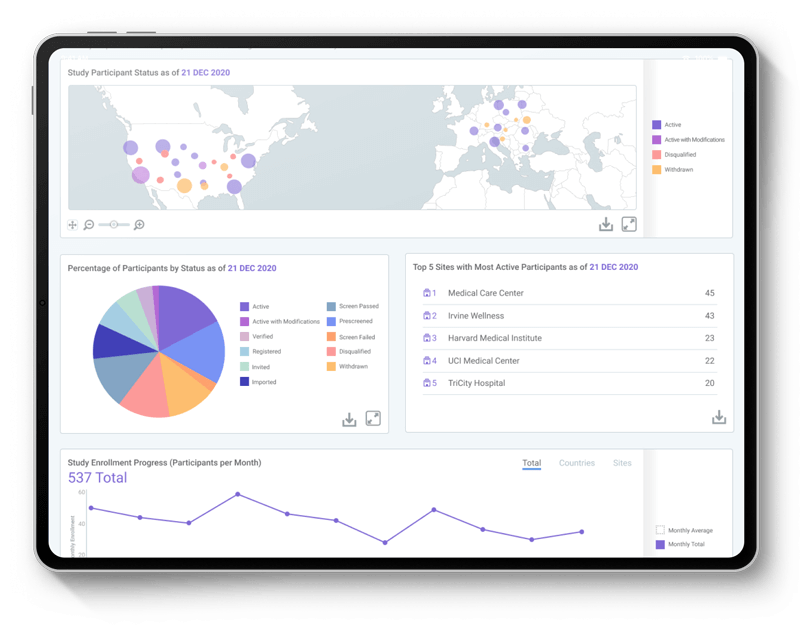
Patient Enrollment and Retention
View your study enrollment progress by country and site. See the probability of each participant dropping out of the study and see the retention rate at each study milestone.
Patient Engagement
View and track your site and participant engagement for all THREAD activities, telehealth, eConsent, and training in a single place. See where your study teams spend time in the portal on documentation review, activity entry, reviewing analytics, and telehealth visits.
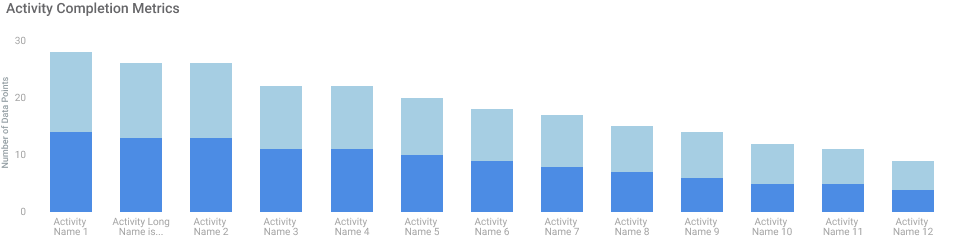
DCT Data Management
See which sites are not completing entry and query activities in a timely manner.
- View the status and quality of data collection, queries, data cleaning, source verification, and data approval.
- Identify sites that are taking longer-than-average time to enter, approve, verify, and sign off on data.
- Understand which items tend to cause queries and which data is missing or changed the most often.
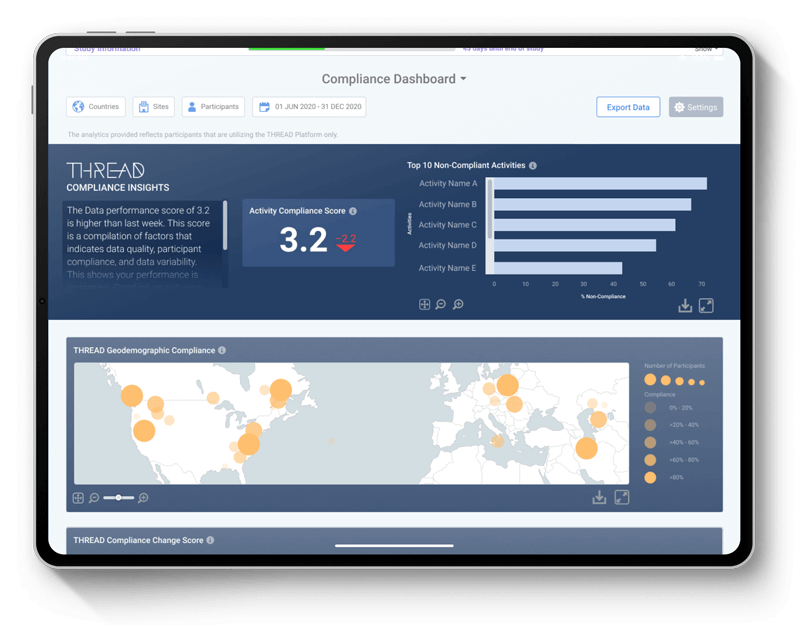
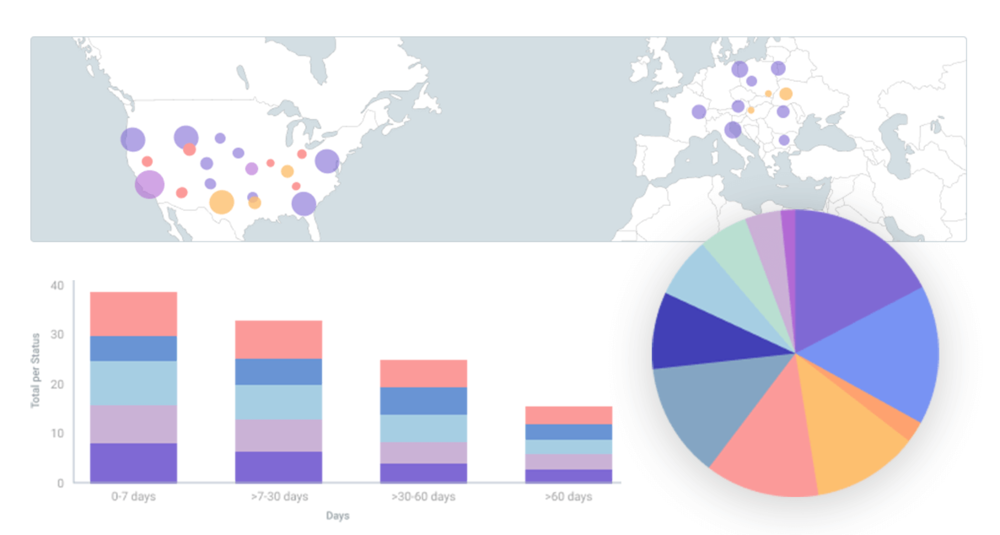
Clinical Study Compliance
The THREAD compliance score indicates the current level of compliance within the study. Reviewing the real-time change in this score alerts your team to down-trending compliance activities. The compliance dashboard shows current and predicted compliance for study activities to help you mitigate issues related to THREAD activity compliance and completion.
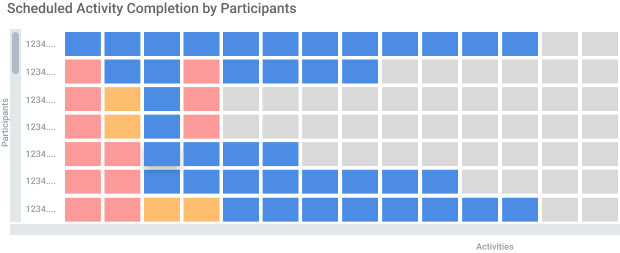
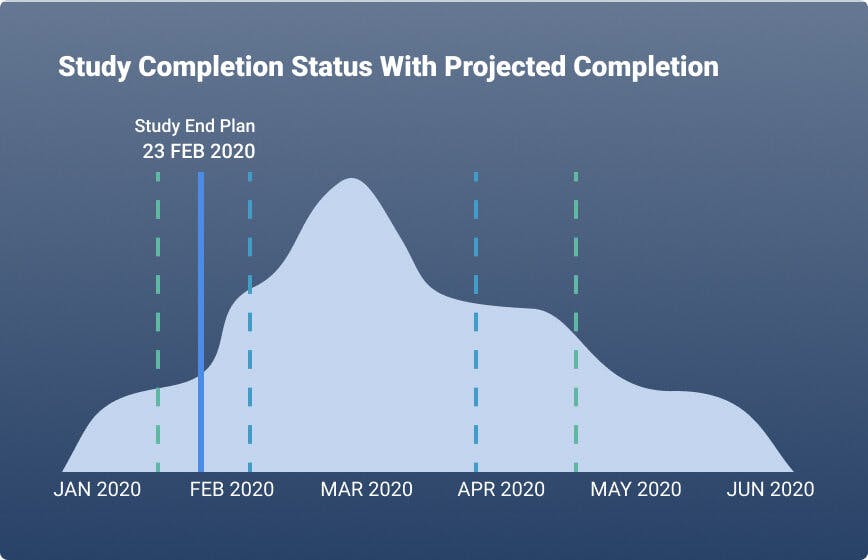
Clinical Study Completion
View your projected completion date for your study based on current enrollment and projected dropout rates. Determine which sites and participants are not completing their activities as intended. View specific activities that may be causing completion challenges including all study ePROs, Surveys, EDC entry, sensor data, learn activities, and telehealth activities.
